You can use the Model screen to run simulations of your scenario against historic or computed market data.
The data behind this modelling is a combination of S&P 500 returns data and 10 year US Govt/Corp Bonds data. This covers a period of 1928 to 2022.
The modelling options available currently are:
Standard
In order to simulate the returns for a scenario, the returns used for the first year will be taken from a start point in the historic data. For instance if the scenario runs from 2024 it could then take the returns data from 1928. When it processes the next year 2025 it then takes market data from 1929, and so on. In this way a scenario which starts in 2024 and runs for 40 years would use historic data from 1928 up to 1968.
The modelling algorithm will take the scenario and use market data as above, iterating through as many possible starting dates as it can, and storing the results of each run. In the example given above, since the length of the scenario is 40 years the latest historic set of dates that it can use will be 1982 to 2022.
Loop Years
This is the same as above, except it extends the available years beyond 2022 by looping back to 1928 when it needs more data. This allows the start year used for modelling to be 1928 all the way through to 2022.
Monte Carlo
This method picks a random year’s returns from the historic data, rather than taking them in sequence. Typically the results of this create more extreme best and worst runs.
Running a Model

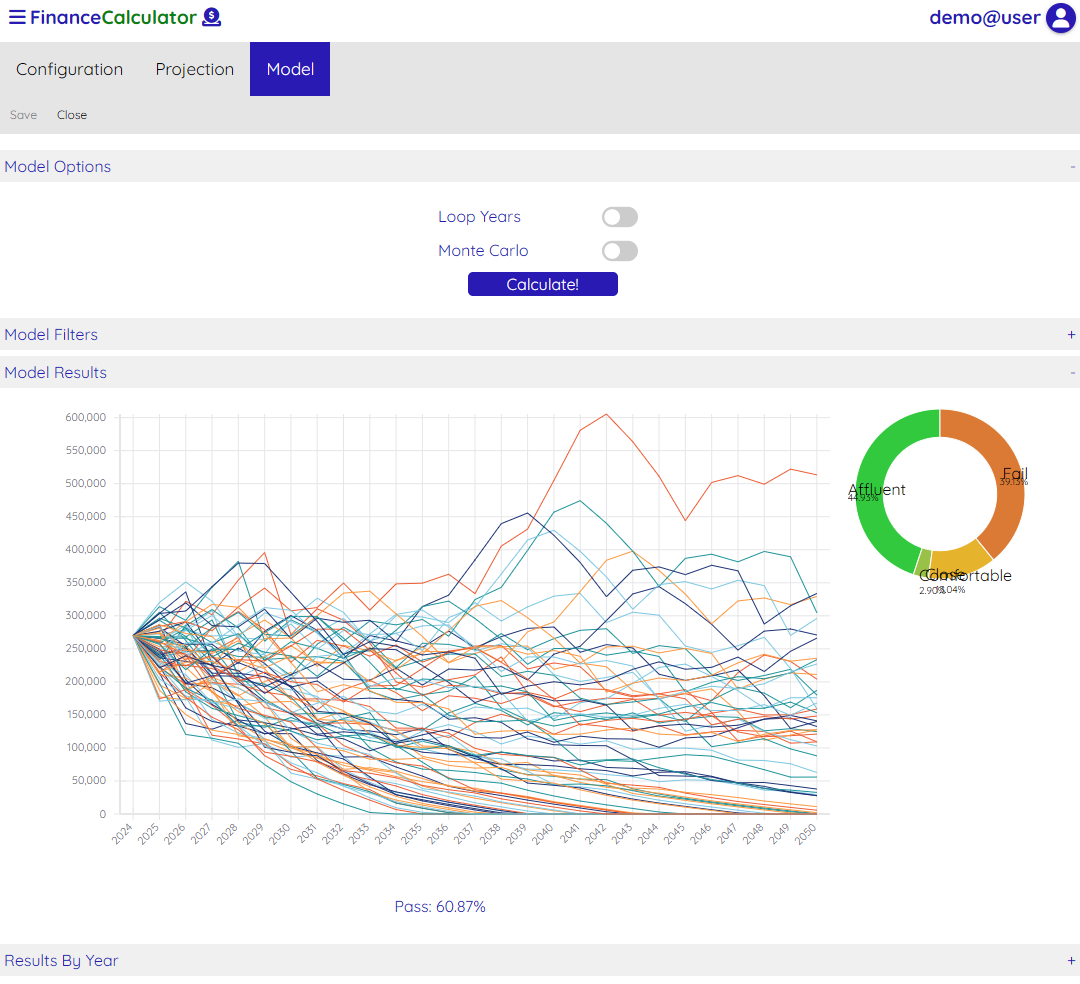
In order to generate your modelling results you simply click the ‘Calculate!’ button.

You can see for this scenario that it succeeds 60.87% of the time and many of the failed runs run out of funds quite quickly. It is typical that a bad set of returns in the first years of retirement can lead to an unrecoverable situation without changing the plan.
The pie chart on the right shows a breakdown of Failed, Close, Comfortable and Affluent results. The definition of these categories is as follows:
- Failed – run out of funds
- Close – does not run out of funds and minimum funds up to 2 years worth of withdrawals
- Comfortable – minimum funds up to 4 years of withdrawals
- Affluent – minimum funds at least 5 years of withdrawals
Hovering over a section of the pie chart will show you the detail.
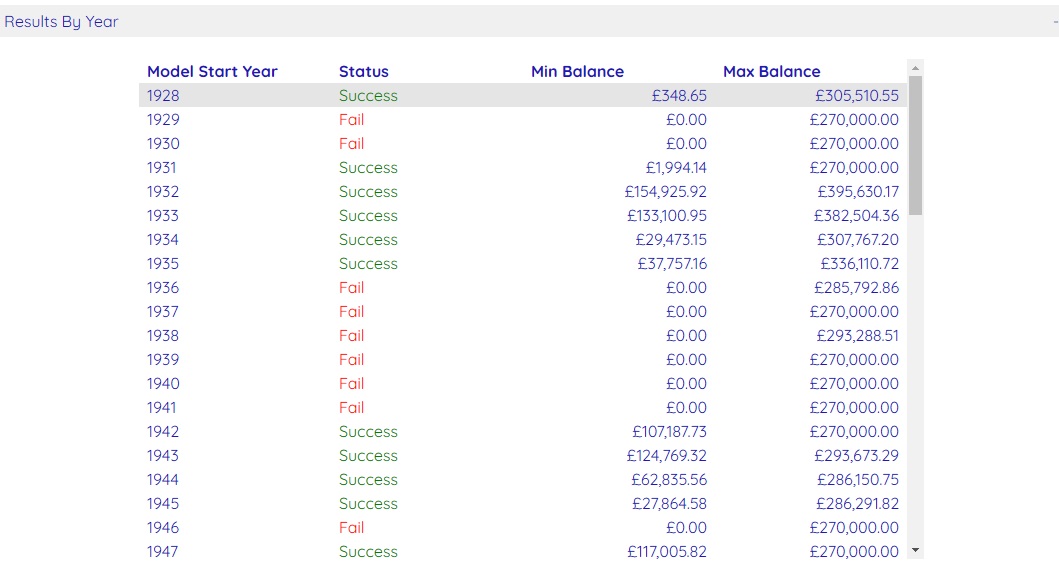
For a breakdown of which ‘seed’ years passed and failed you can open the ‘Results By Year’ section. You may also see that some years have a status of ‘Short’. This means that while they didn’t run out of funds, one or more years failed to withdraw the desired amount. This would happen due to having some restrictive Rules in place.

When a model has been run, the results of how many passes and fails are stored so that they can be displayed on the scenario selection screen.

Highlight a Specific Year
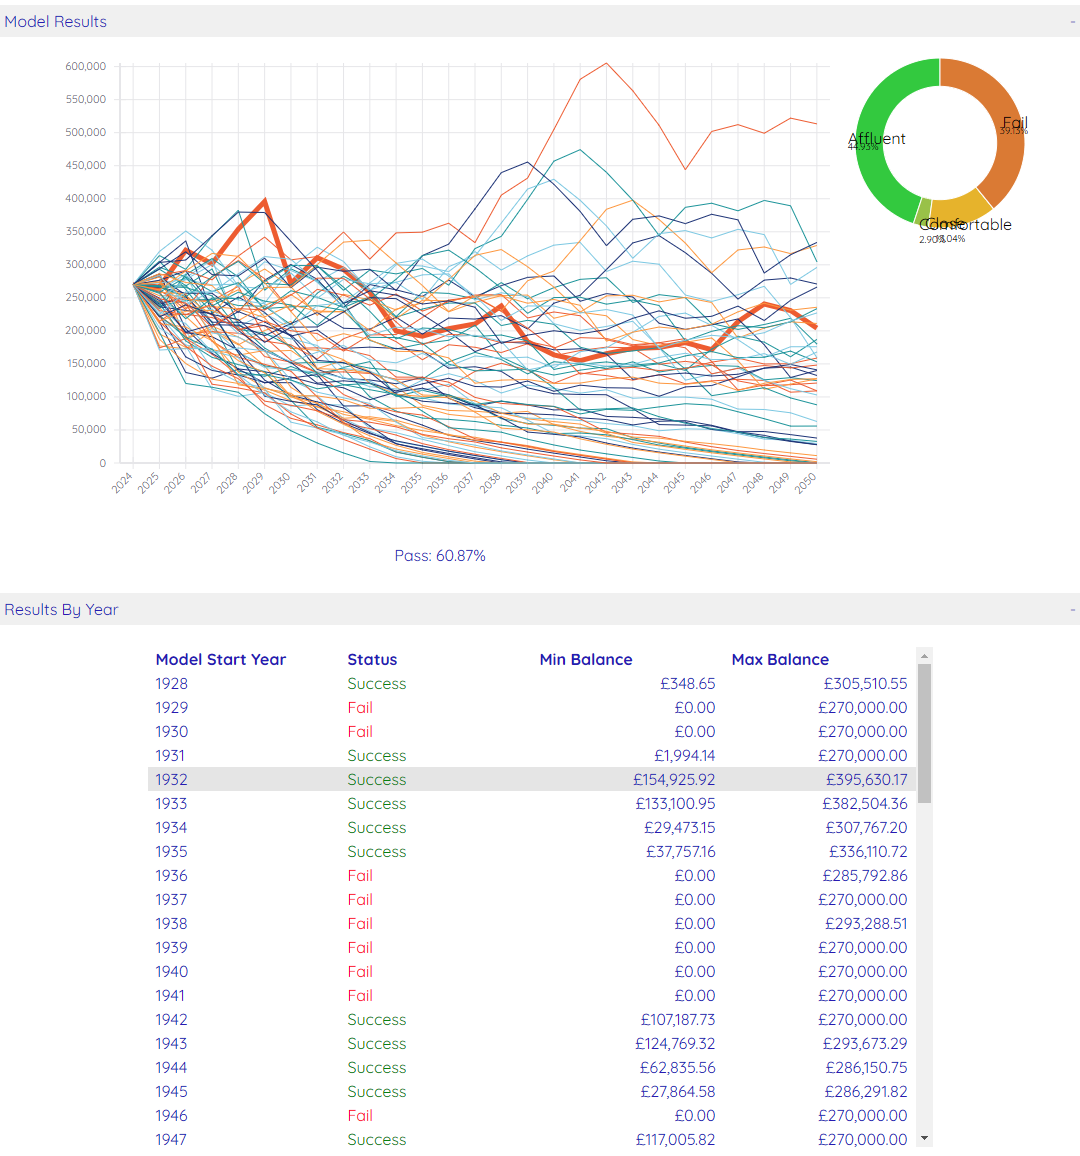
You can highlight a specific year that you want to investigate further by hovering over that year on the Results By Year table. To look into that year in even more detail you can go to the Projection screen, open the Configuration section and choose to use that Model Year.

Filtering Results
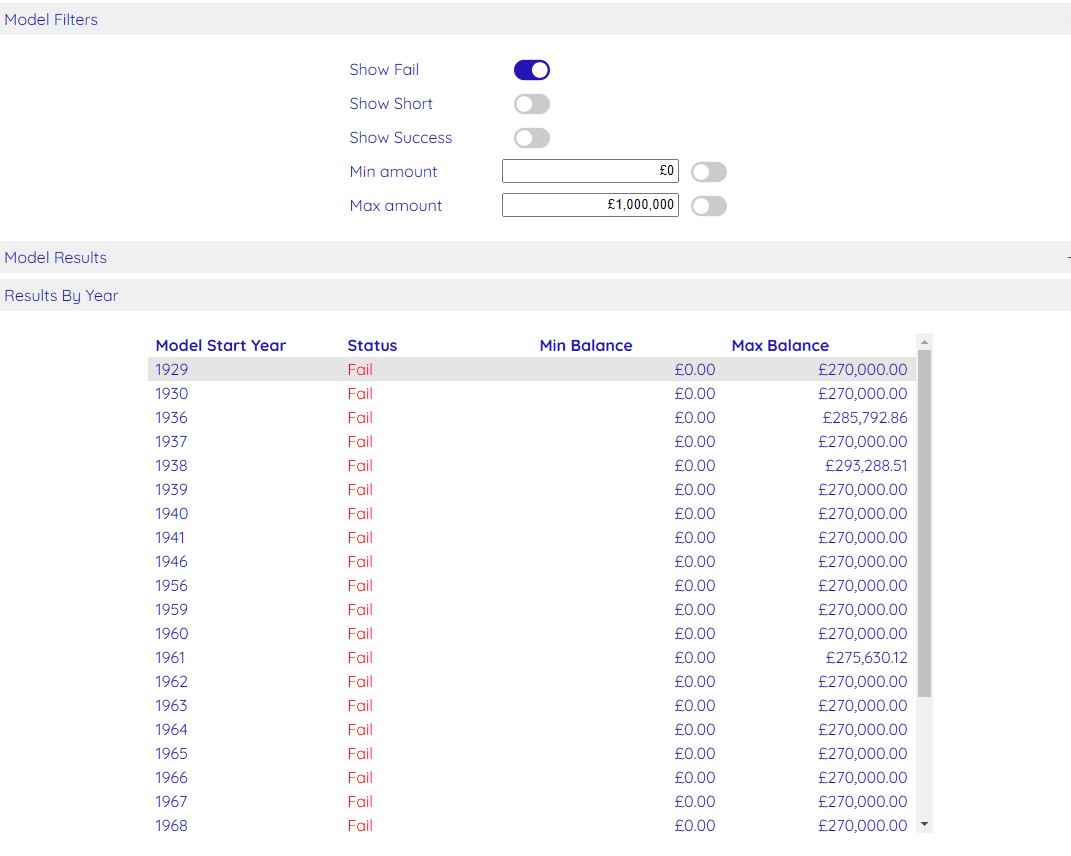
You can use the ‘Model Filters’ to choose the results that you want to see. In this example only Failed model years are being viewed.
