The Projection screen shows you how your scenario will perform, using the expected annual returns for the different investment types.
A higher risk investment type has a higher average return, but it is dangerous to assume that you will get this return every year as this leaves you open to Sequence Risk.
You can get a better idea of how you scenario performs against actual stock market data on the Model screen.
Having said that, you can still get valuable insights into the viability of your scenario, and whether your drawdown strategy is working as planned.
We will use our simple ‘demo-user’ scenario as created in the Getting Started guide.
Balances
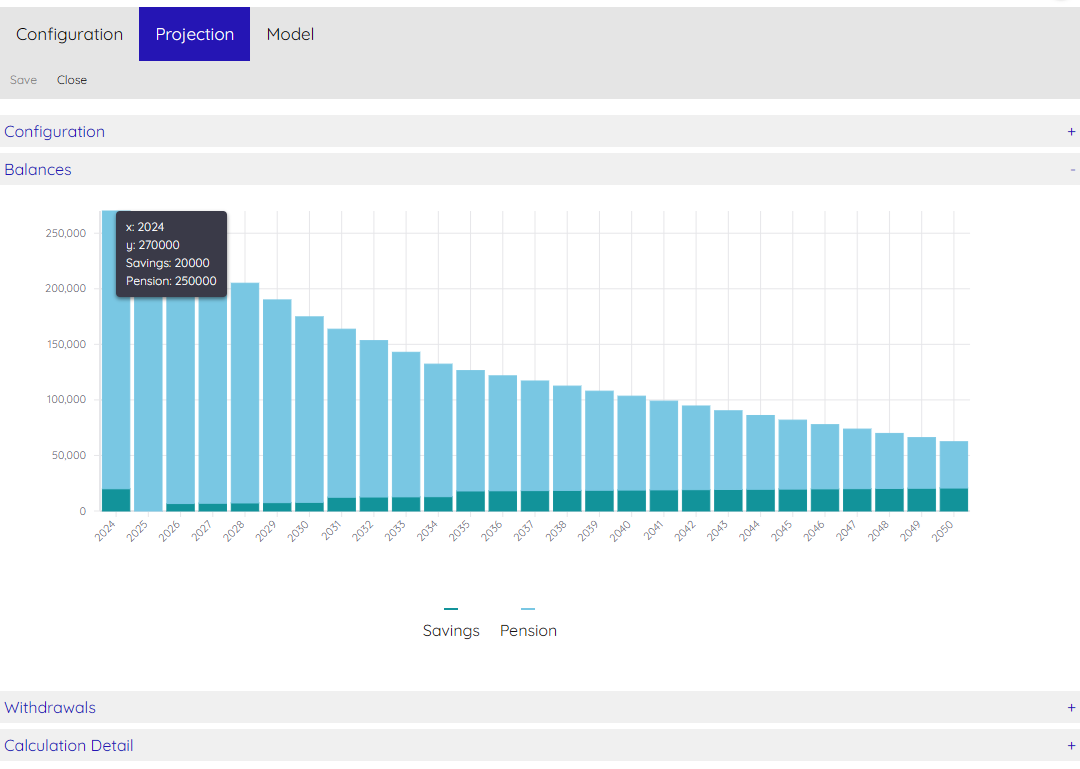
This simple scenario has only the State Pension, a Savings investment and a Private Pension. The State Pension is an Income and so does not show on the Balances graph.
Hovering over a bar will show its year ‘x’, the total value of your investments in that year ‘y’, and then the breakdown of the values of those investments.
Here you can see that the scenario should have funds available up to the end year, so this is an indication that it could be sustainable.
Model Year
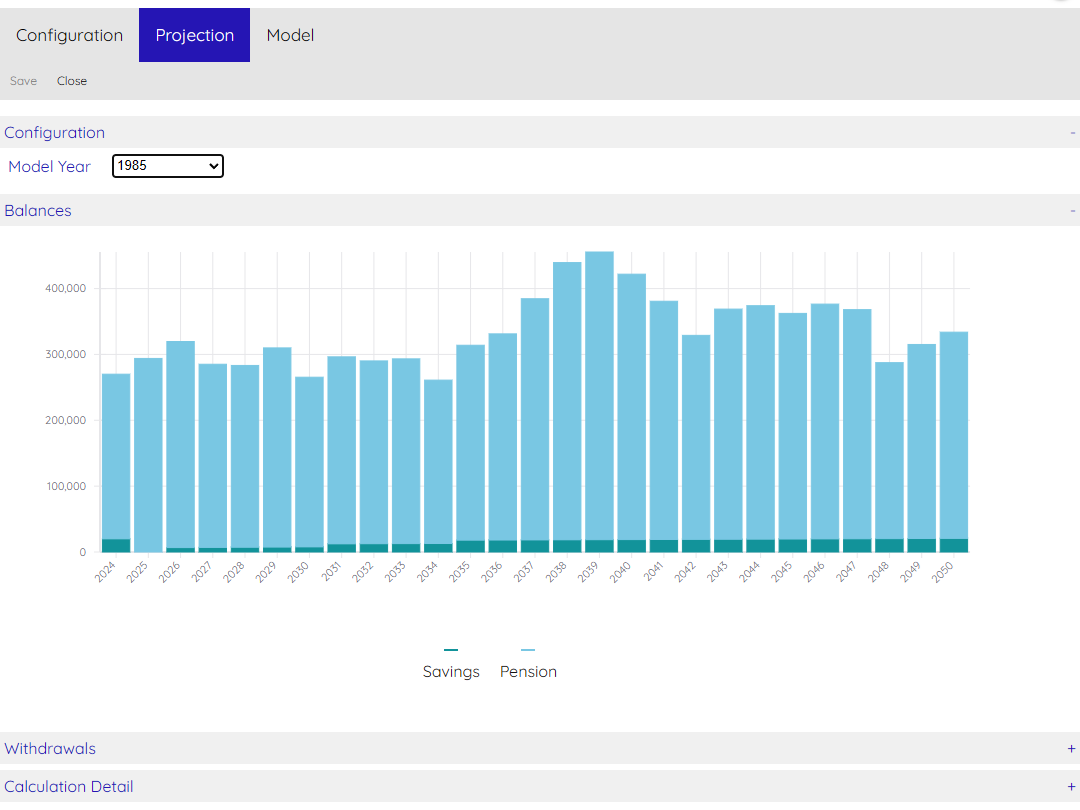
Under Configuration on this screen you can select a Model Year. This will then use the historic model data starting from this year and apply it to your scenario. This lets you further investigate how your scenario performs under real world conditions and helps you to see how well your Rules are working.
Withdrawals
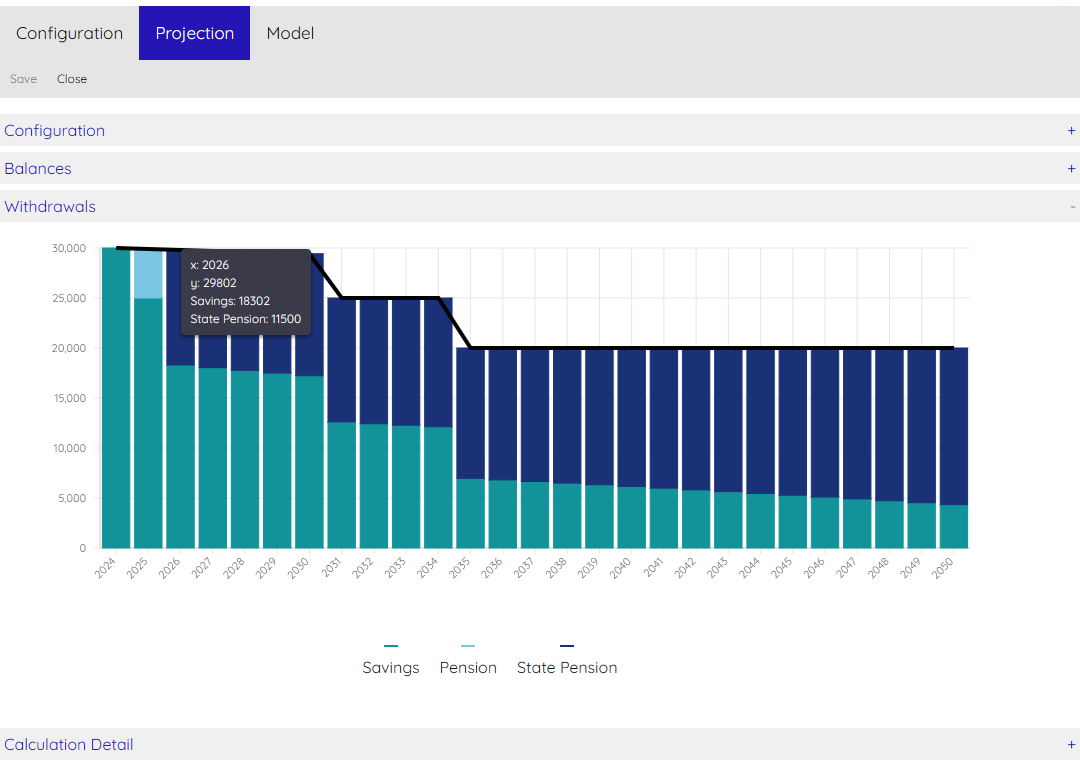
On this graph you can see the required withdrawal amount – the black line – and the breakdown of where the withdrawals come from to cover this. You can now see the State Pension as this does form a part of the withdrawals made.
This scenario has been set up with the Savings investment having a Fund Target of £25,000, which means that at the end of each year money is taken from the other investments and added to the Savings in order to keep it at this level. That is why you see on this graph that most withdrawals are coming from Savings and State Pension. The Private Pension is reducing over time, but as this is done as part of the end of year ‘rebalancing’ it is not visible here. More detail about this in the Scenario Calculation documentation.
Calculation Detail
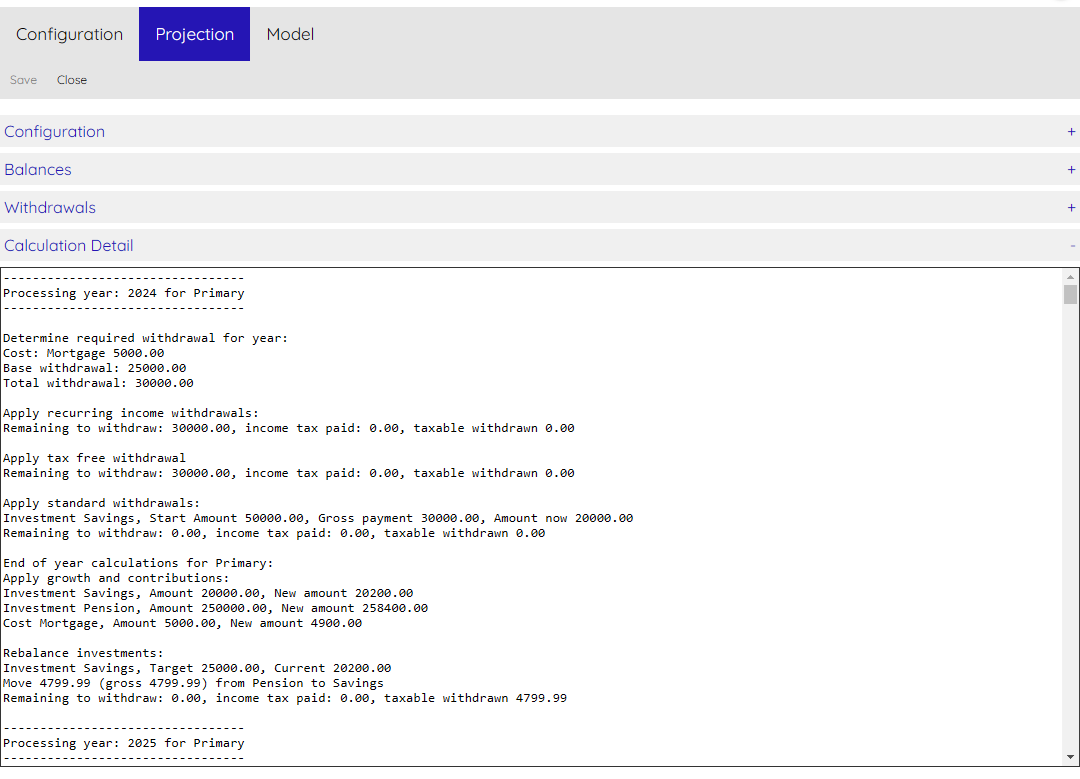
For those that like to ‘look under the hood’ and see what’s really going on with the calculations, you can do that by viewing ‘Calculation Detail’. Let me know if you spot any errors in the logic!
You will see some odd looking numbers that are 1 penny out, this is because computers find floating-point arithmetic hard. It’s not big enough of an ‘error’ to make any real difference with regard to planning, so it’s not something I’ve tried to remedy.